


Abstract
Background: Total joint replacement (TJR) is increasingly performed in older patients with more comorbidities, who are considered at higher risk for postoperative complications. We aimed to identify and calculate the odds ratio of the risk factors for infection, revision and death 3 months and 1 year after TJR as well as for postoperative blood transfusion and longer hospital stay.
Methods: We analyzed all primary total hip arthroplasty (THA) and total knee arthroplasty (TKA) cases in Nova Scotia between Apr. 1, 2000, and Mar. 31, 2014, as identified from the Discharge Abstract Database. We used the Charlson Comorbidity Index as a surrogate measure of comorbidities. We used hospital and physician billings data and Nova Scotia Vital Statistics data to identify the postoperative events in this cohort.
Results: A total of 10 123 primary THA and 17 243 primary TKA procedures were performed during the study period. The mean patient age was 66.1 (standard deviation 11.7) years and 67.1 (standard deviation 9.3) years, respectively. With THA, the risk of infection was higher in patients with heart failure and those with diabetes. For TKA, liver disease and blood transfusion were associated with a higher risk of infection. Revision rates were higher among patients with hypertension and those with paraparesis/hemiparesis for THA, and among patients with metastatic disease for TKA. Significant risk factors for death included metastatic disease, older age, heart failure, myocardial infarction, dementia, rheumatologic disease, renal disease, blood transfusion and cancer. Multiple medical comorbidities and older age were associated with higher rates of blood transfusion and longer hospital stay.
Conclusion: We have identified the risk factors associated with higher rates of postoperative complications and longer hospital stay after TJR. The results enable individualized risk stratification during the preoperative consultation.
Given the aging population, the incidence and prevalence of osteoarthritis is expected to increase, and consequently the demand for total joint replacement (TJR) continues to rise.1 In addition, more TJR procedures are being performed in older patients and those with multiple medical comorbidities.2,3 Such patients are inevitably at a higher risk for serious postoperative complications and may require more rigorous optimization of their medical condition preoperatively and more in-depth discussion when obtaining informed consent.4,5
Many researchers attempting to identify risk factors for complications have focused on a singular adverse event, and only a few investigators have considered multiple complications within the same cohort.6–10 In addition, it is often difficult to generalize the results of a study to different population groups owing to region-specific factors such as ethnic composition and socioeconomic differences among the populations.11,12
The purpose of this study was to determine the risk factors for postoperative infection, revision and death 3 months and 1 year after primary total hip arthroplasty (THA) and total knee arthroplasty (TKA) through the use of large administrative databases. In addition, we sought to identify the risk factors for postoperative blood transfusion and longer hospital stay.
Methods
The study population included all patients who underwent primary hip or knee arthroplasty in Nova Scotia between Apr. 1, 2000, and Mar. 31, 2014, as identified from the Canadian Institute for Health Information Hospital Discharge Abstract Database. Follow-up data were available until the end of 2014/15, which allowed calculation of complication rates for up to 1 full year for all patients. We used Canadian Classification of Health Intervention codes to select the arthroplasty procedures included in the study (Appendix 1, available at canjsurg.ca/007117-a1). Revision procedures were excluded, as were cases identified as emergency cases, which largely include arthroplasty surgery secondary to injury.
We linked data on use of health care services to the study cohort to identify patient characteristics, risks and outcomes. Hospital and physician billings data for the 5 years before and after the index procedure were incorporated to capture information on use from hospitals as well as outpatient observations, which included office visits, home visits and visits to long-term care facilities by physicians. We used Nova Scotia Vital Statistics data to identify deaths that occurred in or out of hospital within the province. To account for socioeconomic factors, we included median neighbourhood income. Statistics Canada produces summary statistics for various geographic levels, the smallest being a dissemination area. We converted patients’ residential postal code to dissemination area to link neighbourhood income to the database.
We focused on patient risk factors including age, sex and comorbidities from the Charlson Comorbidity Index, which were included individually rather than as aggregate score. We also analyzed blood transfusion as a risk factor, as it has been shown to be associated with complications after TJR.13,14 Using International Classification of Diseases codings, we employed algorithms developed for the Canadian Chronic Disease Surveillance System to specify the presence of individual health conditions for which both hospital and physician billing data sources are used. Neighbourhood income, which has been included as a control in previous studies,15,16 was included as a measure of socioeconomic status. We included dummy variables for each health care facility in all models to control for institutional-level factors that may affect outcomes.
The study received ethics approval from the Nova Scotia Health Authority.
Statistical analysis
We used multivariate regression analysis to examine individual associations between risk factors and patient outcomes. We modelled binary outcomes using the logistic procedure. Associations are presented as odds ratios (ORs). Centre A, which is a tertiary care teaching hospital, served as a reference for calculation of ORs compared to 4 regional hospitals within the province. Similarly, the age group of 59 years or less and male sex were used as references in comparison to other age groups and female sex, respectively. We regressed length of stay against covariates using a log-linear specification. We employed the log transformation to account for outliers (i.e., very long length of stay) to reduce skewness in the data and improve the interpretability of the results.
We calculated diagnostic statistics that measure both calibration (how well the models predict actual outcomes) and discrimination (how well the models distinguish between cases and noncases) to examine the overall performance of the models. Since calibration and discrimination measures do not necessarily move in the same direction,17,18 we included estimates for both aspects, namely, the adjusted R-squared (max-rescaled R-squared), the Brier score (which includes information on both calibration and discrimination) and the c-statistic (the area under the receiver operating characteristic curve for binary outcomes). The R-squared adjusted for the number of covariates is reported for the length of stay model. We used SAS 9.4 (SAS Institute) for all analysis.
Results
A total of 27 366 patients who underwent primary joint replacement during the study period were included in the final statistical analysis. Of the 27 366, 10 123 (mean age 66.1 [standard deviation 11.7] yr) underwent primary THA, and 17 243 (mean age 67.1 [standard deviation 9.3 yr) underwent primary TKA. The patients’ demographic characteristics and the overall incidence of major postoperative complications are summarized in Table 1.
Demographic characteristics and overall complication rates for patients who underwent primary hip or knee arthroplasty in Nova Scotia, Apr. 1, 2000, to Mar. 31, 2014
Infection
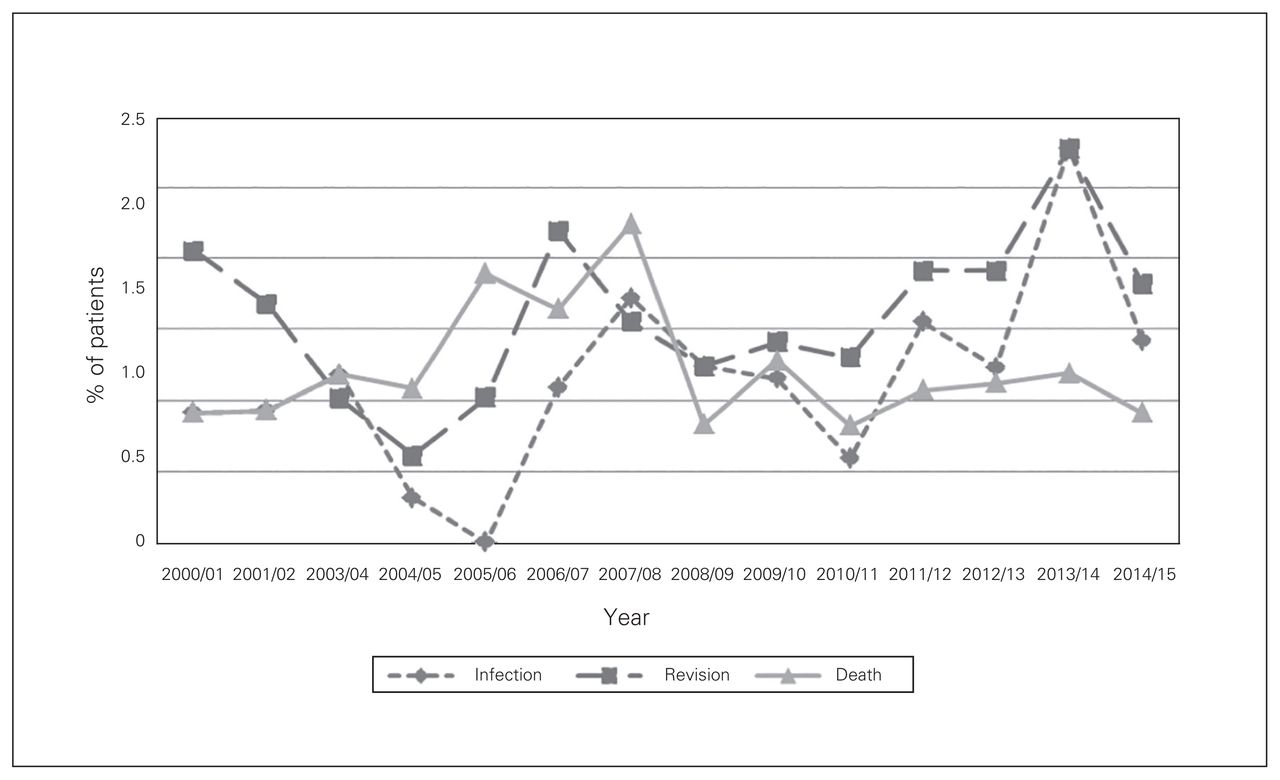
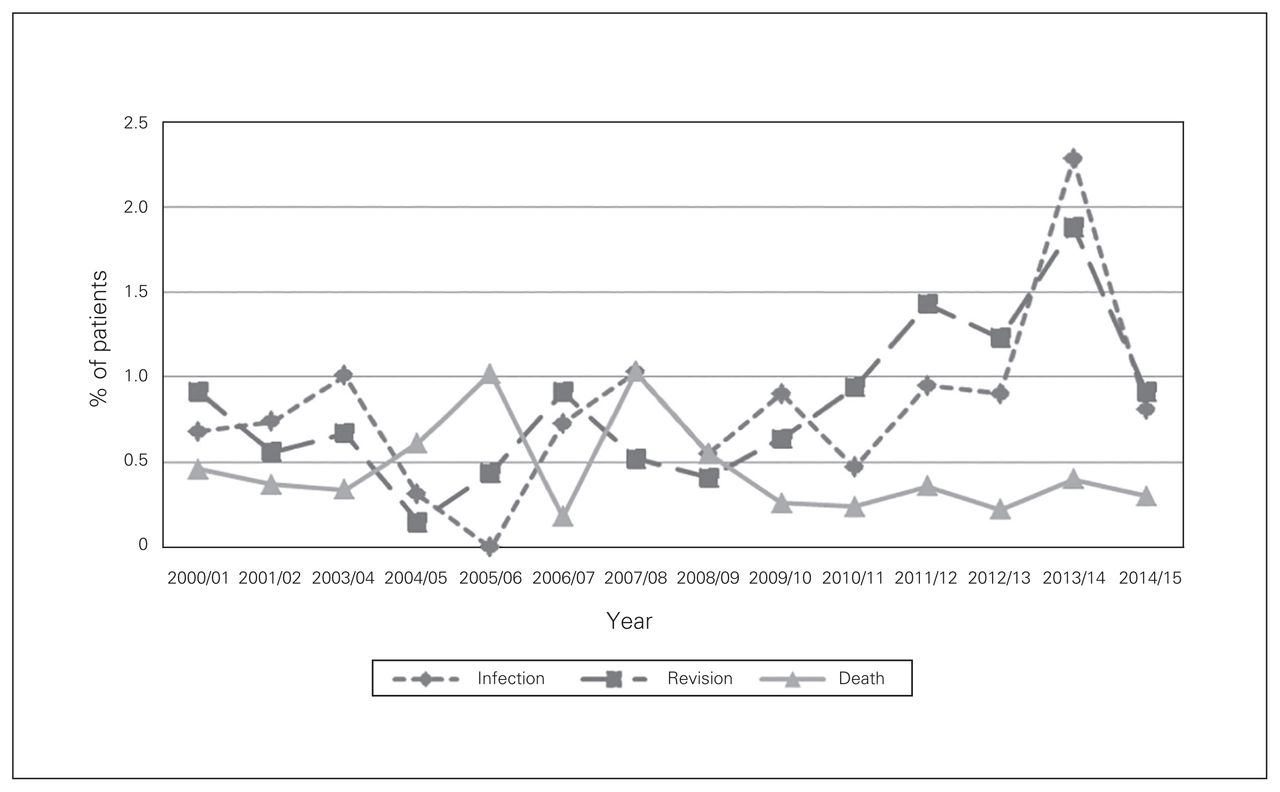
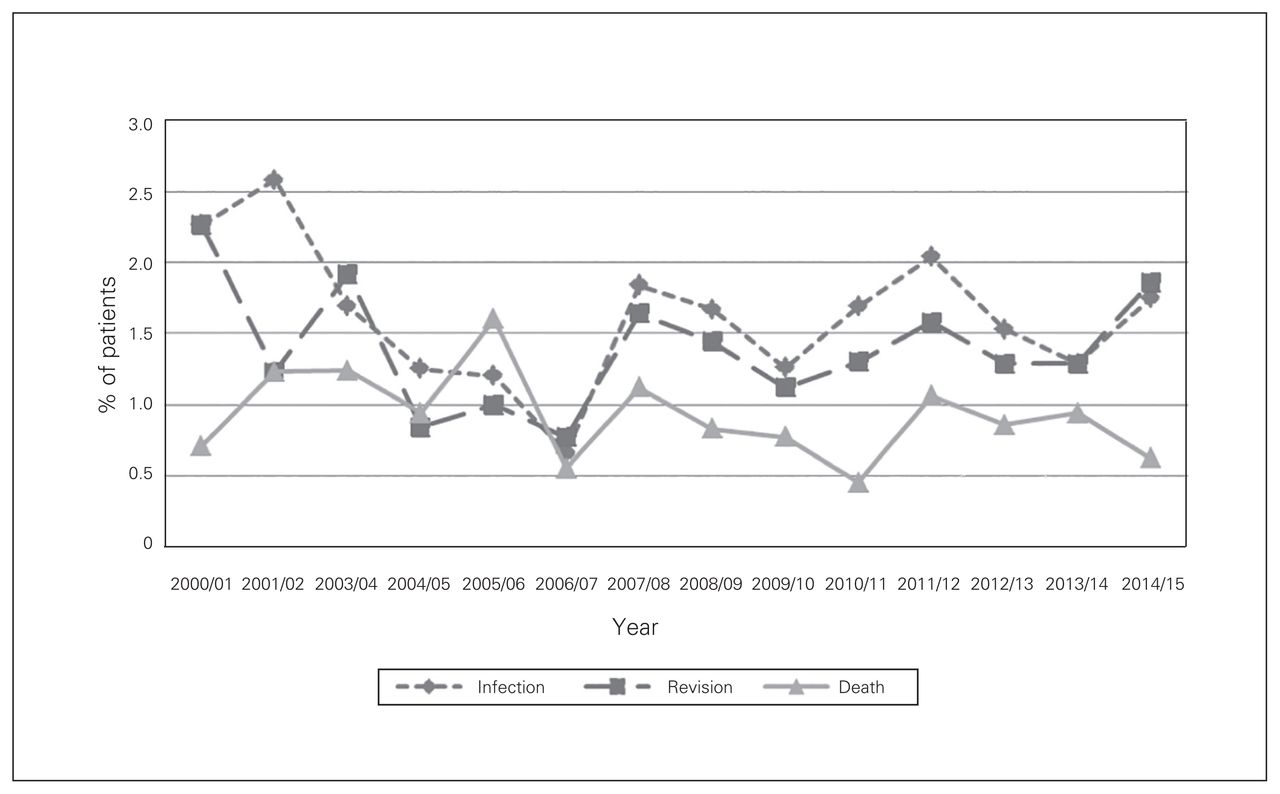
The overall infection rate was 0.9% at 3 months and 1.2% at 1 year following primary THA. Infection rates at 3 months and 1 year increased over the study period (p = 0.005 and p < 0.001, respectively) (Fig. 1 and Fig. 2). Congestive heart failure was associated with increased risk of infection at both 3 months (OR 6.1, 95% CI 2.8 to 13.5) and 1 year (OR 4.8, 95% CI 2.2 to 10.2) (Table 2 and Table 3). Diabetes with complications (defined as diabetes with associated end-organ damage) was a significant risk factor for infection at 3 months (OR 2.0, 95% CI 1.2 to 3.3). Patients with osteoporosis had a decreased infection rate at 1 year (OR 0.4, 95% CI 0.2 to 0.9).

Complication rates at 3 months after total hip arthroplasty in Nova Scotia, Apr. 1, 2000, to Mar. 31, 2014.
Complication rates at 1 year after total hip arthroplasty in Nova Scotia, Apr. 1, 2000, to Mar. 31, 2014.
Association of risk factors with hip infection, revision and death 3 months after total hip arthroplasty
Association of risk factors with hip infection, revision and death 1 year after total hip arthroplasty
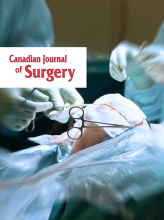
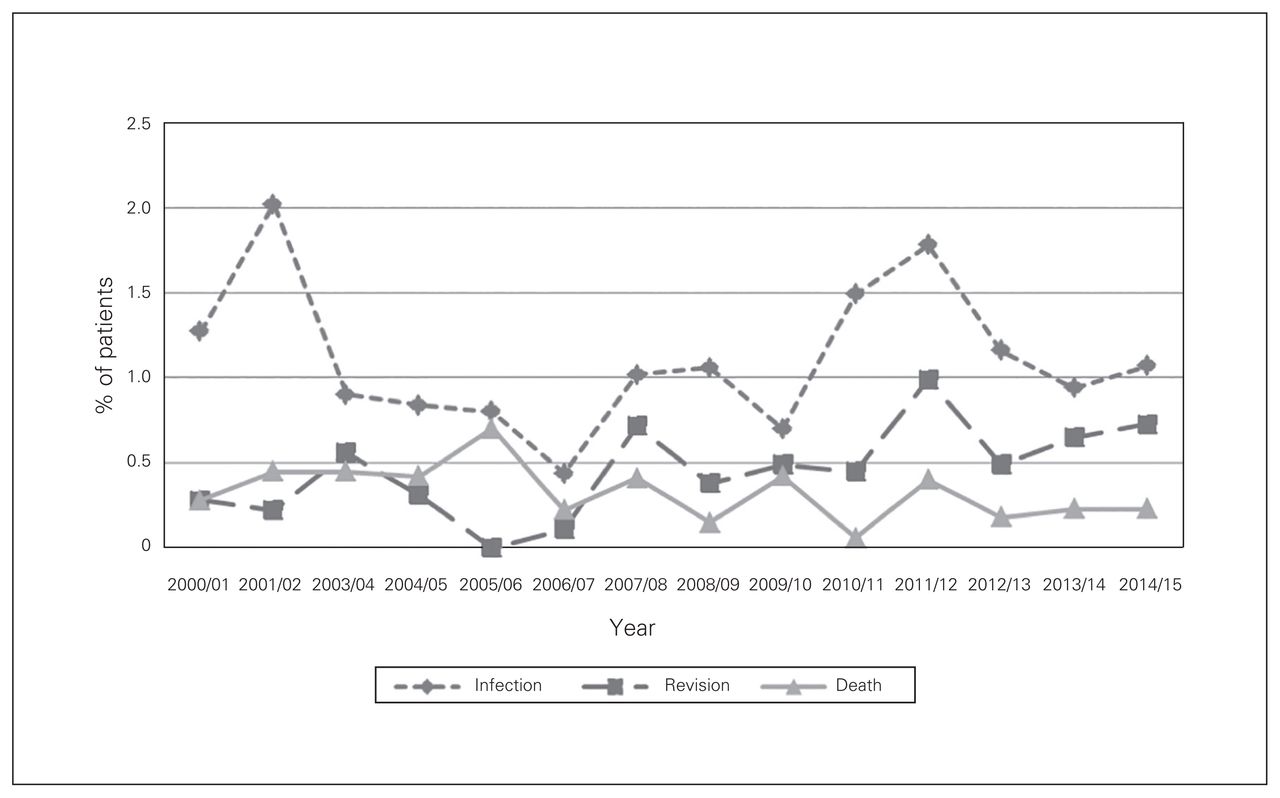
The overall infection rate after TKA was 1.1% at 3 months and 1.6% at 1 year (Fig. 3 and Fig. 4). Mild liver disease was a statistically significant risk factor for prosthetic knee joint infection at both 3 months (OR 3.9, 95% CI 1.6 to 9.6) and 1 year (OR 4.0, 95% CI 1.8 to 8.5) (Table 4 and Table 5). Blood transfusion was shown to be a statistically significant risk factor for infection at 1 year (OR 1.6, 95% CI 1.1 to 2.4). In addition, patients aged 70–79 years (OR 0.6, 95% CI 0.4 to 0.8), those aged 80 or more (OR 0.6, 95% CI 0.3 to 0.9) and women (OR 0.7, 95% CI 0.6 to 0.9) were less likely to have prosthetic joint infection at 1 year compared to their respective reference group.

Complication rates at 3 months after total knee arthroplasty in Nova Scotia, Apr. 1, 2000, to Mar. 31, 2014.

Complication rates at 1 year after total knee arthroplasty in Nova Scotia, Apr. 1, 2000, to Mar. 31, 2014.
Association of risk factors with knee infection, revision and death 3 months after total knee arthroplasty
Association of risk factors with knee infection, revision and death 1 year after total knee arthroplasty
Revision
The overall revision rate after THA was 0.9% at 3 months and 1.6% at 1 year. Revision rates at 3 months (p = 0.001) and 1 year (p = 0.02) increased over the study period (Fig. 1 and Fig. 2). Patients with paraparesis/hemiparesis had an increased revision rate at 3 months (OR 7.1, 95% CI 1.5 to 32.7) (Table 2).
The revision rate after TKA was 0.5% at 3 months and 1.4% at 1 year (Fig. 3 and Fig. 4). Patients with metastatic disease had a significantly increased revision rate at 3 months (OR 5.5, 95% CI 1.4 to 21.6) (Table 4). In addition, patients aged 70–79 (OR 0.6, 95% CI 0.4 to 0.8), those aged 80 or more (OR 0.6, 95% CI 0.3 to 0.9) and women (OR 0.7, 95% CI 0.6 to 0.9) were less likely to undergo revision surgery at 1 year compared to their respective reference group (Table 5).
Death
The overall mortality rate after THA was 0.4% at 3 months and 1.2% at 1 year (Fig. 1 and Fig. 2). At both 3 months and 1 year, congestive heart failure (OR 4.1, 95% CI 1.7 to 10.0, and OR 3.8, 95% CI 2.1 to 6.8, respectively), metastatic disease (OR 34.4, 95% CI 9.4 to 126.1, and OR 15.3, 95% CI 7.2 to 32.7, respectively), blood transfusion (OR 2.6, 95% CI 1.3 to 5.3, and OR 2.1, 95% CI 1.3 to 3.2, respectively) and age 80 or more (OR 9.3, 95% CI 2.0 to 43.3, and OR 3.0, 95% CI 1.6 to 5.6, respectively) were associated with increased mortality rates (Table 2 and Table 3). Patients with previous myocardial infarction (OR 7.9, 95% CI 2.6 to 24.3) and those with dementia (OR 4.4, 95% CI 1.1 to 17.5) were at increased risk for death at 3 months. Diabetes with complications (OR 1.7, 95% CI 1.1 to 2.9) was a statistically significant risk factor for death at 1 year. Women showed lower mortality rates than men at 3 months (OR 0.4, 95% CI 0.2 to 0.8) and 1 year (OR 0.7, 95% CI 0.4 to 1.0).
The mortality rate after TKA was 0.3% at 3 months and 0.9% at 1 year (Fig. 3 and Fig. 4). Identified risk factors for an increased mortality rate at 3 months and 1 year included previous myocardial infarction (OR 22.5, 95% CI 6.9 to 73.9, and OR 6.8, 95% CI 3.3 to 14.0, respectively), congestive heart failure (OR 5.3, 95% CI 2.3 to 11.9, and OR 2.9, 95% CI 1.7 to 5.1, respectively), cerebrovascular accident (OR 4.0, 95% CI 1.6 to 9.8, and OR 2.2, 95% CI 1.2 to 4.2, respectively), rheumatologic disease (OR 2.7, 95% CI 1.2 to 6.2, and OR 2.0, 95% CI 1.1 to 3.4, respectively), renal disease (OR 3.0, 95% CI 1.0 to 8.4, and OR 2.5, 95% CI 1.3 to 4.8, respectively) and age 80 or more (OR 10.6, 95% CI 2.3 to 48.6, and OR 6.6, 95% CI 3.4 to 12.9, respectively) (Table 4 and Table 5).
Blood transfusion
A total of 14.1% and 8.1% of patients received a blood transfusion during their hospital stay for primary THA and TKA, respectively. The overall transfusion rates decreased over the study period for both THA and TKA (p < 0.001 for both). Risk factors for blood transfusion for both THA and TKA included diabetes without complications (OR 1.6, 95% CI 1.1 to 2.2, and OR 1.6, 95% CI 1.2 to 2.1, respectively), previous myocardial infarction (OR 2.6, 95% CI 1.6 to 4.1, and OR 6.9, 95% CI 4.6 to 10.4, respectively), congestive heart failure (OR 1.7, 95% CI 1.2 to 2.3, and OR 2.4, 95% CI 1.8 to 3.1, respectively), osteoporosis (OR 1.5, 95% CI 1.3 to 1.8, and OR 1.4, 95% CI 1.2 to 1.7, respectively), rheumatologic disease (OR 1.6, 95% CI 1.2 to 2.0, and OR 1.5, 95% CI 1.2 to 1.9, respectively), peptic ulcer (OR 1.7, 95% CI 1.1 to 2.8, and OR 1.7, 95% CI 1.2 to 2.4, respectively), renal disease (OR 2.0, 95% CI 1.4 to 2.8, and OR 2.0, 95% CI 1.4 to 2.7, respectively), cancer (OR 1.3, 95% CI 1.1 to 1.6, and OR 1.2, 95% CI 1.0 to 1.5, respectively), age 70–79 (OR 1.7, 95% CI 1.4 to 2.0, and OR 3.0, 95% CI 2.4 to 3.6, respectively), age 80 or more (OR 3.2, 95% CI 2.6 to 4.0, and OR 6.1, 95% CI 4.9 to 7.6, respectively) and female sex (OR 2.4, 95% CI 2.1 to 2.8, and OR 2.3, 95% CI 2.0 to 2.6, respectively) (Table 6).
Association of risk factors with blood transfusion after total hip arthroplasty and total knee arthroplasty
Length of hospital stay
The average length of hospital stay was 5.7 days and 5.1 days for primary THA and TKA, respectively. The average length of stay decreased over the study period for both procedures (p < 0.001 for both). Multiple medical comorbidities, blood transfusion, more advanced age and female sex were all risk factors for longer hospital stay after TJR (Table 7).
Factors influencing length of hospital stay after total joint replacement
Model diagnostics
Table 8 shows the summary diagnostic statistics for each model. Across outcomes, the mortality models performed the best in terms of both calibration and discrimination measures. Most of the c-statistic values were close to or greater than 0.80 for each of the mortality outcomes, which suggests that each is a strong model in terms of discrimination. Lix and colleagues19 suggested that a Brier score less than 0.25 is an acceptable prediction error where the smaller the value, the less the error. The Brier score for all models was well below this threshold. The 3-month models generally performed better than the 1-year models for all 3 measures. The R-squared value was highest for length of stay, which is not surprising given the large number of statistically significant covariates.
Overall diagnostic statistics for study outcomes
Discussion
The aim of the current study was to identify the risk factors for major complications after THA and TKA. We found 1-year infection rates of 1.2% and 1.6% after THA and TKA, respectively, which is in accordance with the literature.20–23 Patients younder than 60 years of age had a significantly higher infection rate than did those aged 70 years or older after TKA but not after THA. This outcome was shown in some previous studies24,25 but not in others.22,26,27 Mild liver disease was also a significant risk factor for infection at 3 months and 1 year after TKA in our study. This is in keeping with the literature: the presence of hepatitis and the markers of active hepatitis such as thrombocytopenia and liver fibrosis have been reported to be closely associated with increased infection rates after TJR.28,29 Another well-documented risk factor for infection is postoperative blood transfusion,13,30 and our study showed its association with infection for TKA but not THA. In a recent meta-analysis, Kim and colleagues31 summarized 6 papers to show the association between allogeneic blood transfusion and surgical site infection. However, only 1 study was conducted solely in patients who had undergone THA, and that study did not show a statistically significant association between transfusion and infection.32 Four studies included in the meta-analysis were conducted in both THA and TKA populations but did not analyze the data for these populations separately.13,33–35 Therefore, although allogeneic blood transfusion has its inherent risks and must be administered judiciously, it does not appear to increase the rate of surgical site infection after THA as it does after TKA. The results also may vary depending on the exact definition of infection (e.g., deep-seated, superficial).32
The rate of revision at 1 year was 1.6% and 1.4% after THA and TKA, respectively. The paraplegia/hemiplegia category includes patients with flaccid or spastic paralysis secondary to problems in the central or peripheral nervous system. Paraplegia/hemiplegia was associated with early revision after THA but not after TKA. In patients with paraplegia or hemiplegia, THA has been shown to result in a higher revision rate owing to the more complex nature of the surgery, which is linked to increased rates of dislocation, aseptic loosening and periprosthetic fracture.36,37 The lower revision rates in women and in patients aged 70 or more in our study may have been due to the lower infection rates in these groups.
Mortality rates after TJR were closely associated with various medical comorbidities and age. This correlation is well established in the literature.38–40 Despite the increasing number of older patients with more medical comorbidities undergoing primary TJR, overall mortality rates are generally decreasing.41–46 However, the number of major postoperative complications after TJR has been increasing, resulting in increased morbidity and higher economic burden.46
Strengths and limitations
The main strength of the current study is the use of a large, representative population. Consequently, these findings are particularly helpful for local physicians and physicians in areas where the population shares characteristics similar to those in Nova Scotia. In addition, we used the same cohort of the population to analyze multiple postoperative outcomes, which is relatively uncommon, as most studies focus on a single outcome. The challenges of using administrative data for research purposes have been well documented.47,48 Along with limited information, inaccuracies of diagnostic coding to measure outcomes have been highlighted.49,50 As administrative data have become more ubiquitous in health research, however, data entry personnel have developed expertise in coding, and researchers have learned to use techniques such as data linkages across multiple sources to enhance accuracy and increase the functionality of these readily available data sources.
Conclusion
Our study identified multiple risk factors for complications and a longer hospital stay after TJR. The results enable individualized risk stratification during the preoperative consultation, which will, in turn, allow involvement of the appropriate consulting services to optimize the patient’s preoperative medical condition.
Acknowledgements
The authors thank the Nova Scotia Department of Health and Wellness for granting access to the data and extracting the required variables in a timely manner.
Footnotes
Competing interests: None declared.
Contributors: C. Rhee, L. Lethbridge and M. Dunbar designed the study. L. Lethbridge acquired the data, which all authors analyzed. C. Rhee and L. Lethbridge wrote the article, which all authors reviewed and approved for publication.
- Accepted October 20, 2017.
References
Article tools


